Stormwater Program
Happy New Water Year, Tahoe!
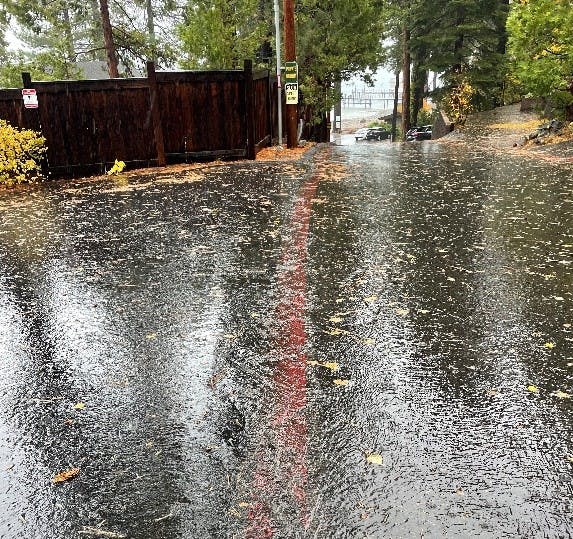
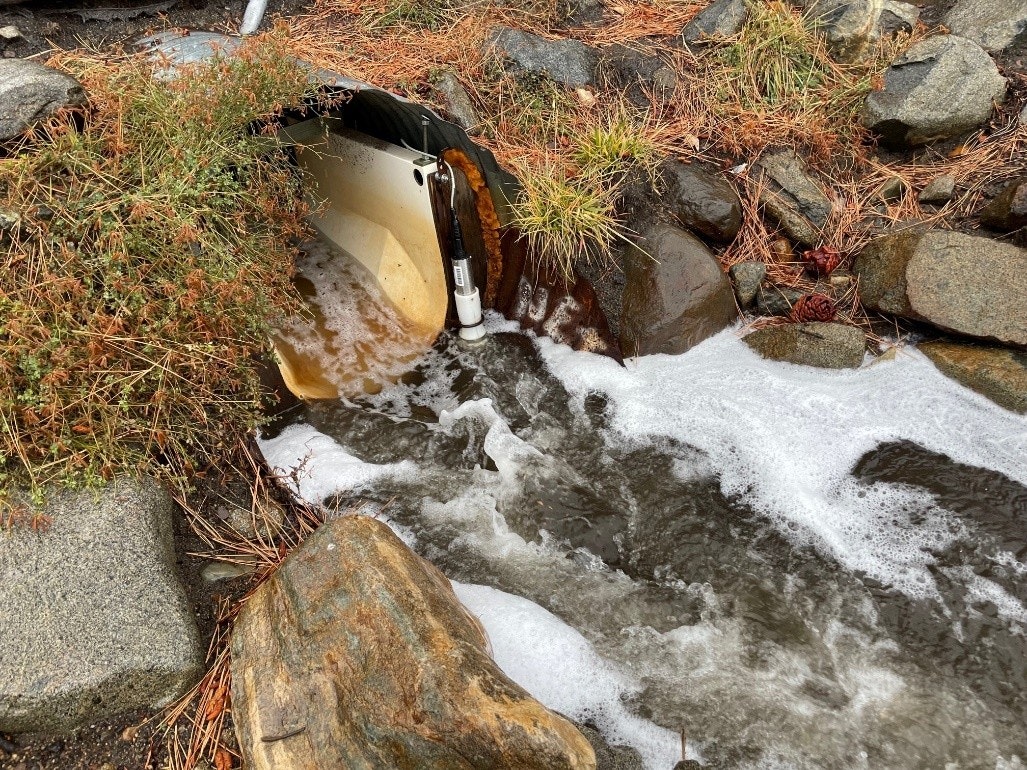
October 1 marks the beginning of the water year in the Tahoe Basin—a crucial date for stormwater monitoring. The water year provides a framework for tracking precipitation and runoff across seasons that are defined differently than what we normally think of as seasons. We calculate precipitation totals, runoff volumes, and fine sediment particle and nutrient loads by season so we know when and how the greatest pollutant loads are delivered to Lake Tahoe, helping scientists and local agencies manage stormwater and protect clarity.
The water year is divided into three distinct seasons, each with its own weather patterns and impact on stormwater and lake health:
Fall and Winter (October 1 – February 28):
This period is dominated by frontal systems that move in from the Pacific. These storms bring rain and, when temperatures drop, snow that builds Tahoe’s crucial snowpack. Unfortunately, this is also when we see the highest volumes of urban stormwater runoff. As rain and melting snow flow through urbanized areas, they carry pollutants like sediment and nutrients, resulting in some of the highest pollutant loading to the Lake.
Spring (March 1 – May 31):
As temperatures warm, the snowpack begins to melt. Snowmelt is typically much cleaner than stormwater runoff. It replenishes the lake with relatively low pollutant levels - one of the many reasons a strong snowpack is so important.
Summer (June 1 – September 30):
Summer brings mostly dry weather, with the occasional high-intensity thunderstorm. These storms can mobilize large amounts of sediment due to their intensity, but because they’re short-lived and generate less runoff overall, the total pollutant load tends to be lower than in other seasons.
As we begin a new water year, we will restart our precipitation, runoff, and pollutant tracking system so that we can compare annual and seasonal values across different years and determine how these parameters may be changing over time. We hope to see decreasing pollutant loads in response to all the stormwater treatment strategies that have been implemented over the past two decades. Some monitoring locations do show positive change!